Brue Flood tweet bot
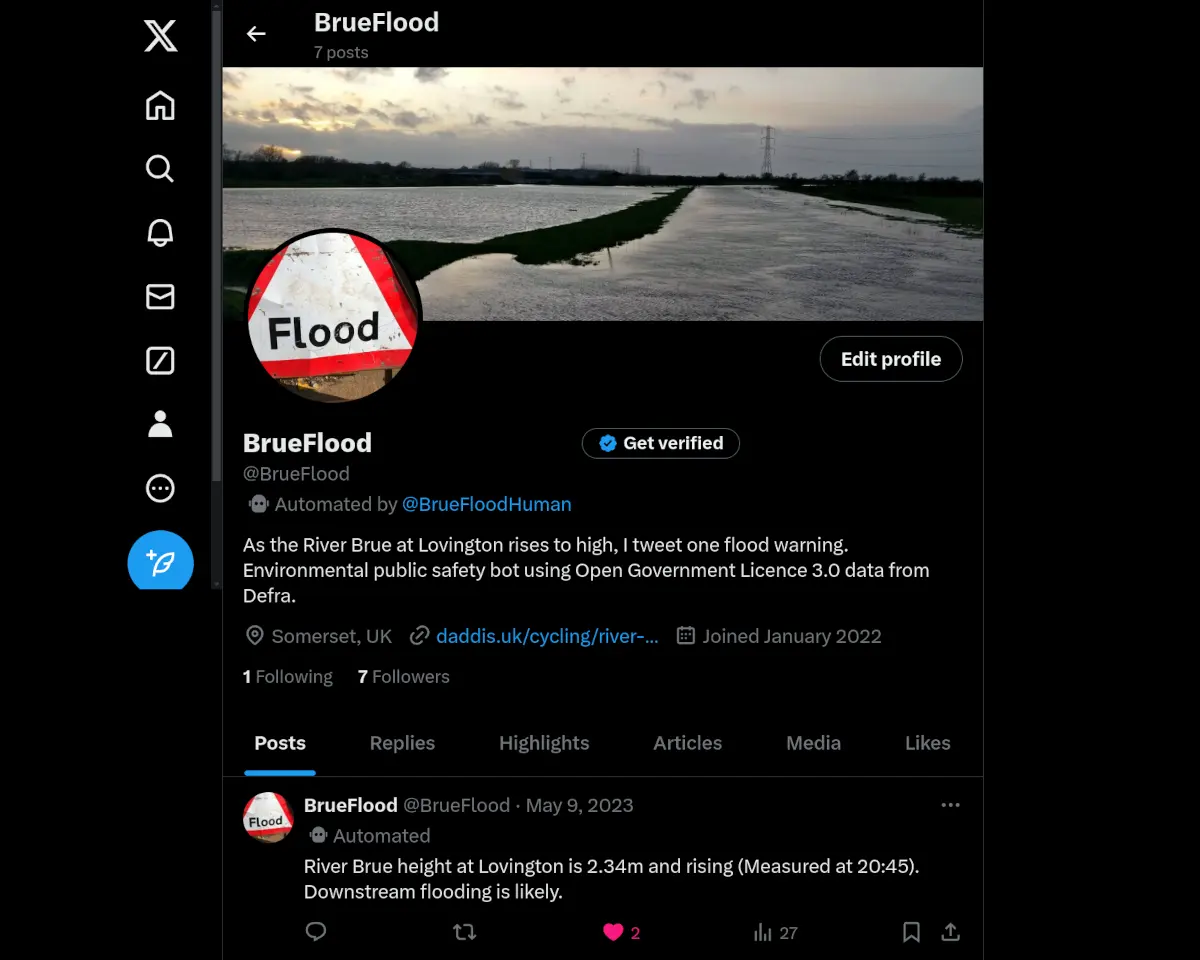
As part of this growing set of flood tools, there is also a Twitter bot which tweets as the River Brue at Lovington goes above its typical range.
@BrueFlood tweet bot
Owing to the level of interest, this mapping application is being moved to its own home at https://somersetlevels.uk .
For feedback and messaging a new facebook.com/somersetlevels.uk page has been created.
I made this map so I could easily see where rivers feeding into the Somerset Levels were high, and hence where the wettest fun was likely to be found. None of the data on this map is new, it's all available elsewhere, it's just presented in a way that I wanted: To be able to see everything visually in one place, at a glance.
If you tap on a river level, tide meter, river or catchment you should get an "info balloon" with more details with optional links to further Environment Agency pages, including, in some instances, web cams of monitoring locations.
The server & map fetch the latest readings from Environment Agency monitoring stations and show the rivers, catchments & visualises the river levels as a "VU meter" of the type found on DJ mixers.
Each river level gauge has 5 greens, one orange and 3 reds. The levels of the meters are not relative to each other, but rather represent known levels of the monitoring station itself from historical data. If a meter goes orange, the river level is over the typical normal range for that point on the river. If a meter is showing 3 reds, it is very close to setting a new recent record.
There is one tidal meter, at Hinkley Point. I'd like to add more, but presenting that much data would crowd the map, so one will have to suffice for now.
At further zoomed-out levels, there is a precipitation radar layer.
Top left, just under the +/- zoom controls is a fullscreen button. This is very helpful for maximum screen real-estate if you are on mobile, but also looks awesome if you have a massive widescreen monitor. It gets rid of all this waffle.
The more I learn and the more effort I put into its development, the longer the list of things I want to try and add grows. In the pipeline is somehow displaying rainfall levels from the Environment Agency meters, flood alerts and flood areas... It's very much a work in progress, I hope you find it useful.

As far as I can tell, if everything is working, the river level gauge readings on the map should generally be around 30 minutes old. The server requests fresh data every 10 minutes, the readings are updated by the monitoring stations every 15 minutes, although it can take longer, and the map itself requests the data from the server around every 12 minutes. There is a info box in the bottom right of the map which notifies when data is being collecting, and a "ping" icon around each river level gauge as it does.
The Environment Agency does stipulate that the API is Beta and should not be relied upon.
Precipitation imaging is generated every 10 minutes and requested every 10, so should be up to 20 minutes old.

Whilst I find floods exciting in their beauty and raw energy and know that large areas of the Somerset Levels are "designed" to flood, I am also aware that flooding is dangerous and very distressing to those negatively impacted. I am always a helper, where possible, in those times of distress; more on Somerset Rescue later...

As part of this growing set of flood tools, there is also a Twitter bot which tweets as the River Brue at Lovington goes above its typical range.
@BrueFlood tweet bot